Ski accidents and random sampling
“Dutch wounded through skiing: a remarkable increase of 14 percent” writes the The Dutch newspaper NRC. Is this really a noticeable increase or just random sampling? A quick statistical procedure provides the answer.
Last weekend NRC, a Dutch newspaper, published an article in bold face on page 3 with the heading Dutch wounded through skiing: a remarkable increase of 14 percent. Looking for explanations, the newspaper mentions that this change cannot be explained by different snow conditions or by an increase in the number of people having a ski holiday, and concludes that it must be due to personal factors such as taking higher risks and less thorough preparation.
When counting the number of accidents each year we cannot expect this year’s count to equal next year’s. There will always be some random fluctuations. The question arises which fluctuations are merely random and which are systematic? To answer such questions we use statistics, that is, sampling distributions are used for the data we collect. In psychological research the normal distribution for continuous variables or the binomial distribution for dichotomous variables are often used. For counts of events in a given time frame, such as the number of accidents in a year, the most natural distribution is the Poisson distribution. The Poisson distribution has a single parameter,  , which represents both the mean and the variance. That is a higher mean implies a higher variance. According to the NRC article, last year there were about 700 injuries, this year about 800, so the most likely estimate of
  would be 750. Is the change from 700 to 800 really a remarkable jump or just random sampling from a probability density function? With the R program it is simple to draw random numbers from a given density. Drawing five numbers at random from a Poisson distribution with
  = 750, I obtain 783, 738, 756, 722, and 813.
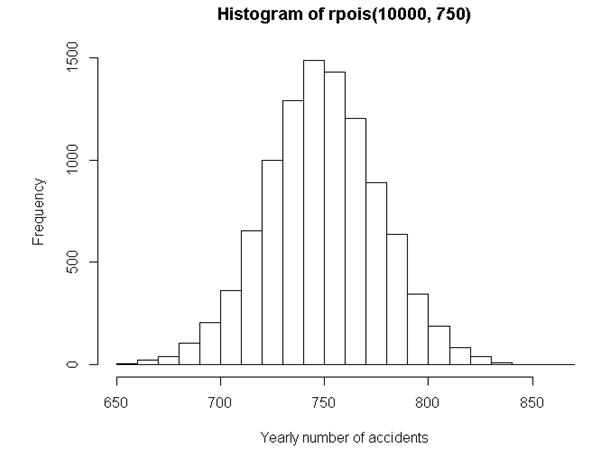
From this simple sequence of random numbers we can conclude that it is not really strange to observe 722 accidents one year, and 813 a year later; a change similar to the one presented in the newspaper. Such a change can already be expected purely based on chance. In order to obtain a better overview I sampled 10,000 observations from the Poisson distribution, which resulted in the following histogram.

The minimum in this histogram is about 650, while the maximum is about 850. So, it all seems a big fuss instead of a real change. Moreover, the conclusion that we are taking higher risks does not seem to have any foundation at all.


